Tutorial
In this page we’ll teach the basics of using Inspect WandB through an informative example. Through this tutorial you will learn how to install Inspect WandB, run an example eval, and navigate the information logged to WandB Models and WandB Weave.
This tutorial is divided as follows:
Example setup - Setting up the environment and installing dependencies
Understanding WandB UI tabs - Overview of the different interface sections
WandB Models integration - Using WandB Models for run tracking and reproducibility
WandB Weave integration - Using WandB Weave for eval analysis and comparison
Comparing evaluations - How to compare results across different models
Accessing reproducibility information - Retrieving data for reproducing results
If you want to check out the results of this tutorial without running yourself, you can view our example project here
Example setup
Inspect WandB is compatible with any Inspect eval and you can follow along with this tutorial using an eval of your choice.
If you don’t have an eval to hand, feel free to clone inspect_evals, a collection of evals for Inspect AI.
We recommend using uv for this tutorial which can be installed from here.
For standalone installation instructions, please see Installation and Setup.
In a clean Python project, run the following:
uv pip install "inspect_evals @ git+https://github.com/UKGovernmentBEIS/inspect_evals.git"
# set your API key for whatever model you want to run
export ANTHROPIC_API_KEY=...
Next, to install the latest version of the extension with support for WandB Models (by default) and WandB Weave ([weave] extra), run:
uv pip install "inspect-wandb[weave]"
and to tell WandB which account and project to log to, run:
wandb login
wandb init
or if running an interactive shell session is not feasible, configure env variables as specified in Configuration.
We’re ready to run! Let’s try running an eval:
uv run inspect eval inspect_evals/agentharm --model anthropic/claude-4-0-opus --limit 10
which will run claude-4-0-opus on the first 10 sample of AgentHarm.
Once the eval completes, you should see the following line in the console logs:
wandb: View project at: https://wandb.ai/YOUR-TEAM-NAME/YOUR-PROJECT-NAME
Going to that link, your view should look something like:
Understanding WandB UI tabs
In the demo project, I’ve run the above AgentHarm eval, as well as uv run inspect eval inspect_evals/hellaswag --limit 10 --model openai/gpt-4.1-nano-2025-04-14,anthropic/claude-3-haiku-20240307, so the tutorial will follow
WandB Models: Workspace
The primary function of the WandB Models integration is to auto-log information about a run so it can be faithfully reproduced in future.
The rule of thumb is that one inspect eval ... or inspect eval-set ... produces one Run in WandB Models, so even if you execute multiple models or tasks, with one inspect eval ... command, all the data will belong to a single WandB Models Run.
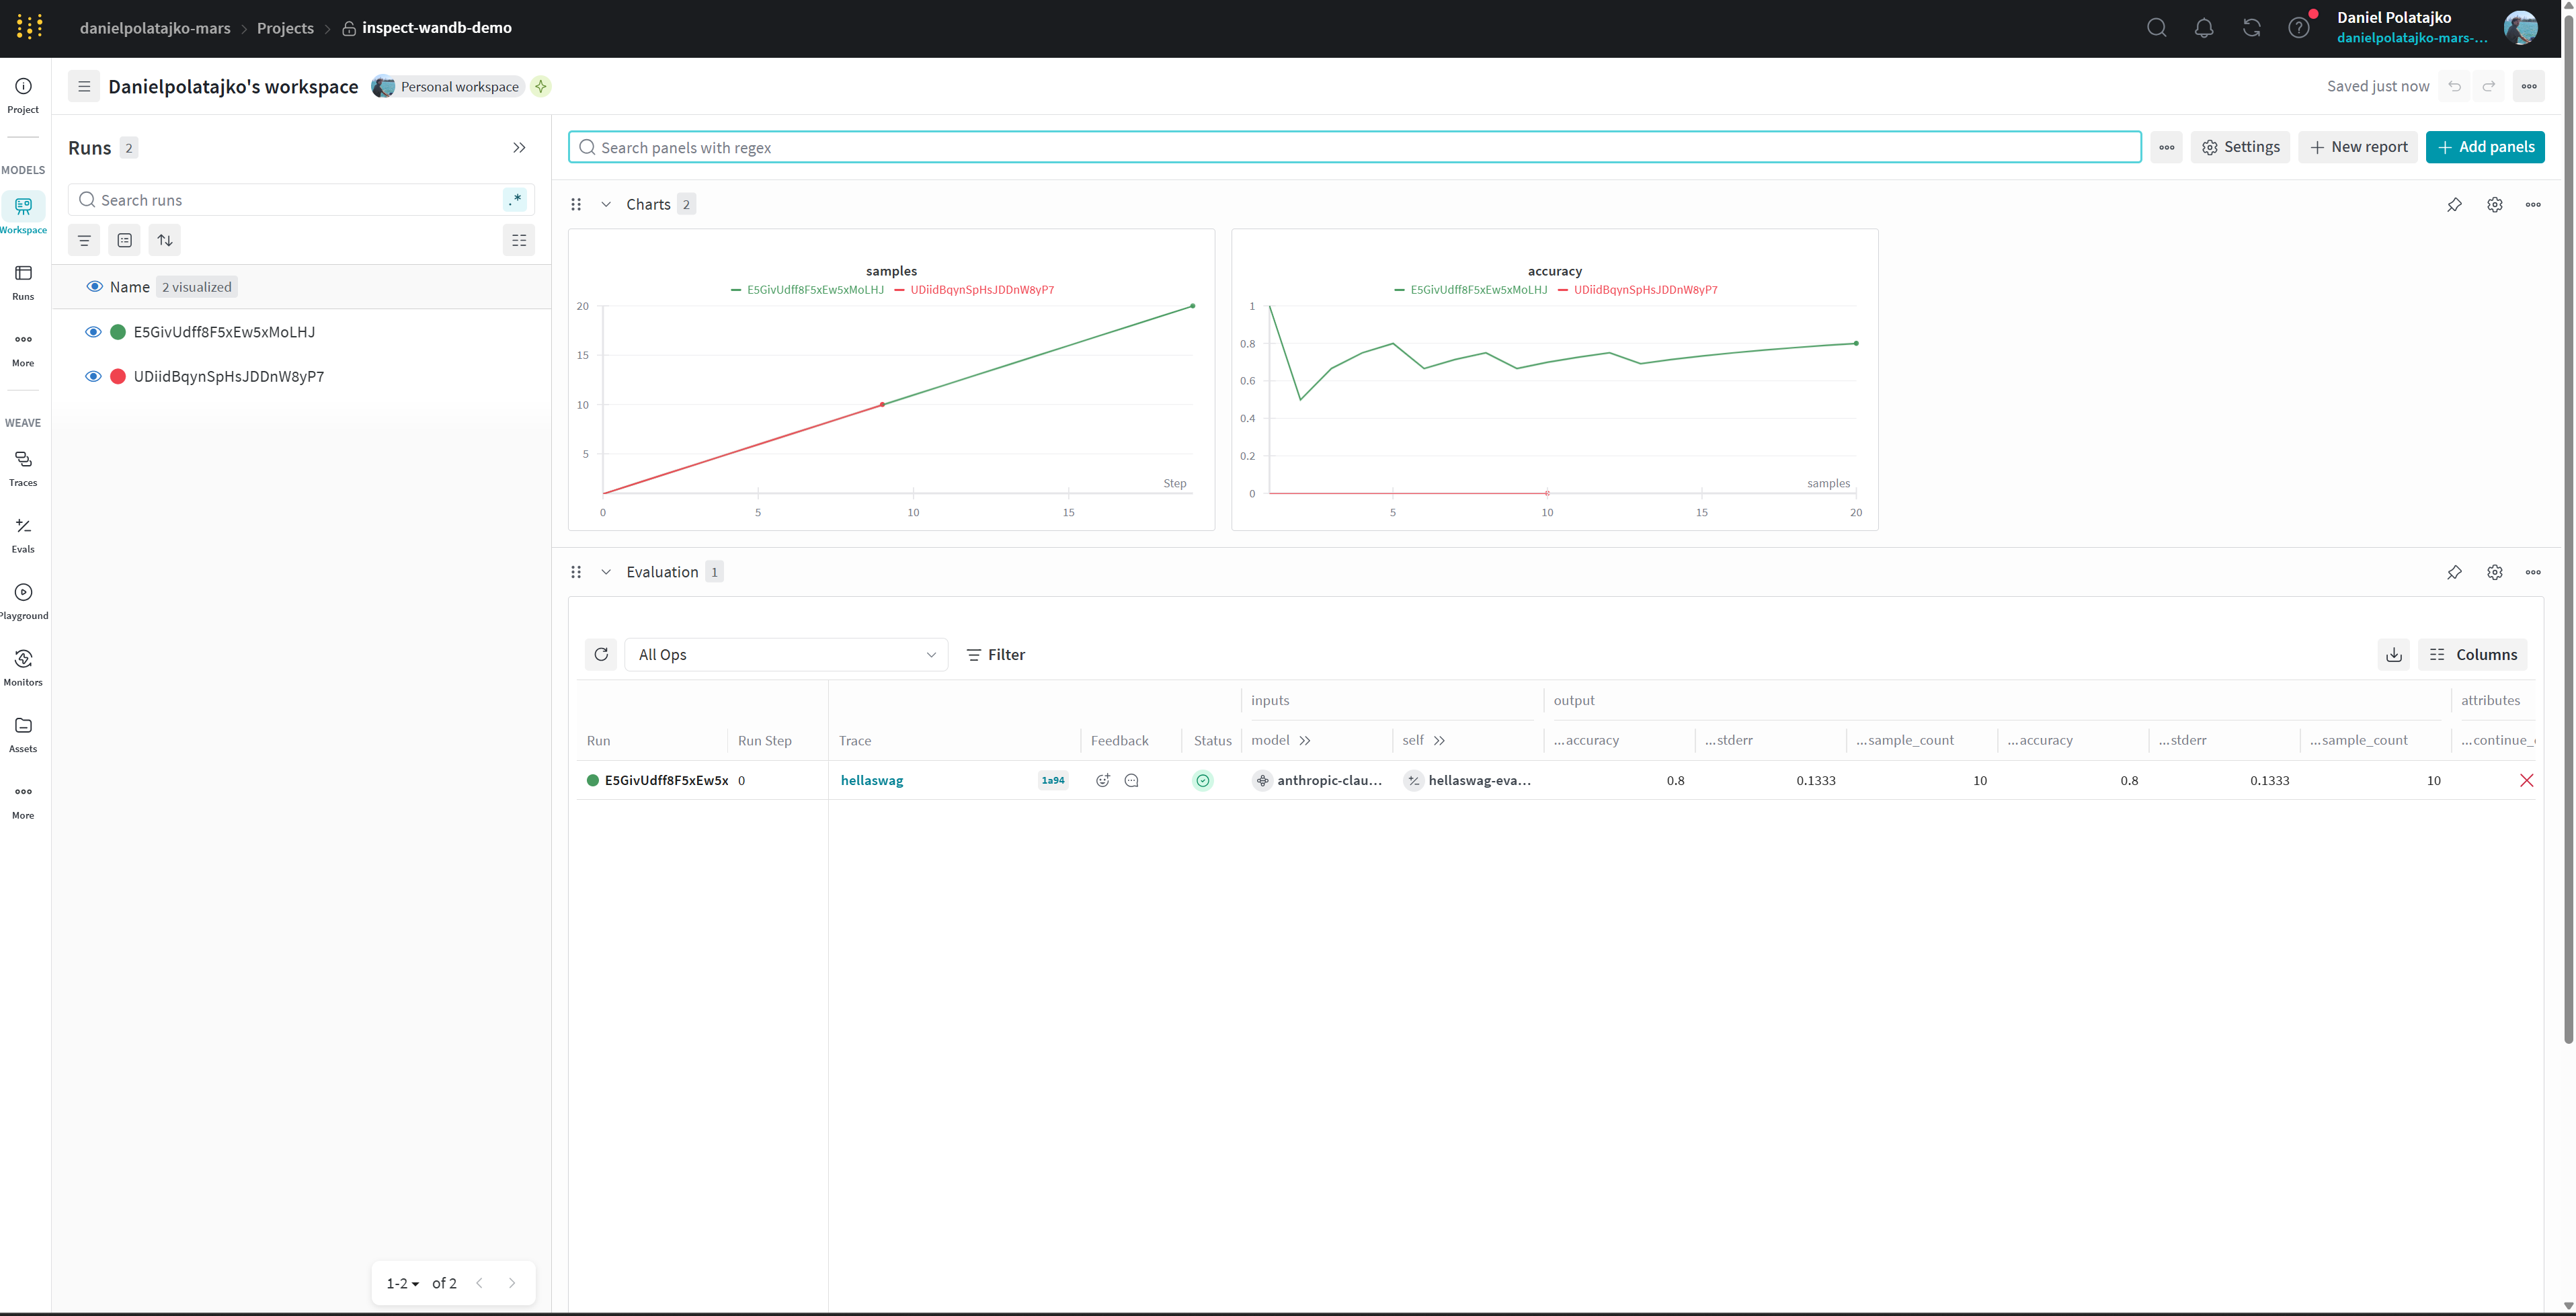
Your workspace tab might look something like:
On the left we can see all the runs that we have executed (named by their run_id or log_dir) and on the right we see:
Charts: at present only logs the number of samples so far (usually
y=xline) and the currentaccuracymetric if the eval has a scorer metric calledaccuracy. We plan to make this more useful in the futureEvaluation: the basic Weave view for the run, which allows you to click through to Weave
System: auto-logged wandb metrics – probably not very interesting if you’re running API models but may be useful if you are self-serving
WandB Models: specific run
Clicking on a run on the left, we can see the Overview:
 which contains information about the system, git state, and the
 inspect eval ... command used to trigger the evaluation.
This view also contains a link to the relevant Weave dashboard, as well as the paths of the log files associated with the Run. This can be useful for keeping track of which log files correspond to a given WandB Run.
To keep track in the opposite direction, the extension also write the Models and Weave URLs to the Inspect metadata in the log file, shown in the screenshot below:

Clicking on Files tab, we see:
 which contains files auto-logged by WandB Models such as
 requirements.txt which contains versioning info.
You can choose to have additional files logged alongside the Run by setting:
INSPECT_WANDB_MODELS_FILES='["README.md", "Makefile"]'
The files and state information can be useful for reproducing and further investigating the run.
WandB Weave: Evals
Weave is WandB’s interface for tracking LLM evaluations. Inspect WandB uses Weave to record scores and performance metrics relating to Inspect runs, and allows you to analyseand share eval results using the Weave UI.
The Evals tab under WandB Weave is the Weave homepage, and should look like:

This tab contains evals which previously ran, alongs with attributes which primarily consist of an aggregation across samples of any Inspect Scorer in the eval, and some additional metadata like tokens used and cost.
The rule of thumb is that one model on one Inspect task corresponds to one eval in the Evals dashboard.
The first field is status which shows if the eval is in progress, succeeded, or failed. This can be useful for long-running evals, allowing you to connect to WandB on mobile to check status.
If you are recording multiple evals in a single W&B project, you may find that some columns are redundant for some evals. You can choose which columns to hide or show in the top-right.
Clicking on “Filter” at the top left, it’s possible to filter by certain attributes, and once done, by clicking on “Save View” at the top right, save the view. There are also convenience filters for filtering on the eval and the dataset (both of which correspond to an Inspect task).
Saved views can be edited and returned to at a later time.
The current view shows only hellaswag runs:

WandB Weave: exploring a particular eval
Clicking on an eval and then clicking on trace tree (the stack of cards at the top right) you will see all the traced function calls made during the eval run.
The Trace tree will contain traces of every solver step, model call, and scoring operation that contributed to each sample’s final result.

The model call traces also allow you to view transcripts for that model interaction. This view can be useful for finding interesting transcripts in agentic evaluations.
 Clicking on “Playground” at the top right opens an interactive chat view where the chat history is editable and it’s possible to query various models and perform quick experiments.
Individual traces can also be explored under the “Traces” tab.
Comparing evals
To run multiple evals on the same dataset you can:
uv run inspect eval inspect_evals/hellaswag --limit 10 --model openai/gpt-4.1-nano-2025-04-14,anthropic/claude-3-haiku-20240307
Marking two evals on the left and clicking compare:
 we see:
 which shows various comparison metrics between
 gpt-4.1-nano and claude-3-haiku on agentharm.
It is also possible to compare more than two models on the same and different evals.
Referencing an eval of interest
Having filtered and found an eval of interest in WandB Weave UI, click on the eval from the list > Summary > Scroll down to Attributes and click on to inspect > run_id (if not using eval-set) or inspect > eval_set_id. These IDs are used to track Models runs, so you can cross reference between Weave and Models interfaces.